注重体验与质量的电子书资源下载网站
分类于: 编程语言 人工智能
简介

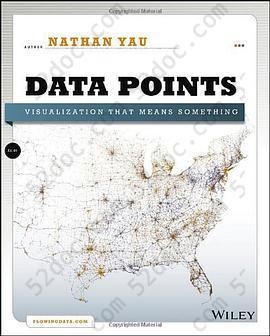
Data Points: Visualization That Means Something 豆 8.3分
资源最后更新于 2020-08-23 08:21:03
作者:Nathan Yau
出版社:Wiley
出版日期:2013-01
ISBN:9781118462195
文件格式: pdf
标签: 数据可视化 visualization data 可视化 数据分析 Visualization 计算机 计算机科学与技术
简介· · · · · ·
A fresh look at visualization from the author of Visualize This Whether it's statistical charts, geographic maps, or the snappy graphical statistics you see on your favorite news sites, the art of data graphics or visualization is fast becoming a movement of its own. In Data Points: Visualization That Means Something, author Nathan Yau presents an intriguing complement to his ...
目录
Introduction xi
1 Understanding Data 1
2 Visualization: The Medium 43
3 Representing Data 91
4 Exploring Data Visually 135
5 Visualizing with Clarity 201
6 Designing for an Audience 241
7 Where to Go from Here 277
Index 291
1 Understanding Data 1
2 Visualization: The Medium 43
3 Representing Data 91
4 Exploring Data Visually 135
5 Visualizing with Clarity 201
6 Designing for an Audience 241
7 Where to Go from Here 277
Index 291


