注重体验与质量的电子书资源下载网站
分类于: 云计算&大数据 人工智能
简介

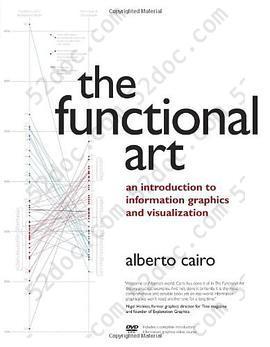
The Functional Art: an Introduction to Information Graphics and Visualization 豆 8.6分
资源最后更新于 2020-10-05 18:42:48
作者:Alberto Cairo
出版社:New Riders
出版日期:2012-01
ISBN:9780321834737
文件格式: pdf
标签: 数据可视化 Visualization 设计 可视化 计算机 信息设计 infographic visualization
简介· · · · · ·
Unlike any time before in our lives, we have access to vast amounts of free information. With the right tools, we can start to make sense of all this data to see patterns and trends that would otherwise be invisible to us. By transforming numbers into graphical shapes, we allow readers to understand the stories those numbers hide. In this practical introduction to understanding...
目录
Table of contents:
Part 1 - FOUNDATIONS
• Chapter 1 - Why Visualize? Information to Wisdom
• Chapter 2 - Forms and Functions: Visualization as a Technology
• Chapter 3 - The Beauty Paradox: Art and Communication
• Chapter 4 - Exposition, Exploration, and the Complexity Challenge
Part 2 - COGNITION
• Chapter 5 - The Eye and the Visual Brain
• Chapter 6 - Visualizing for the Mind
• Chapter 7 - Images in the Head
Part 3 - PRACTICE
• Chapter 8 - Creating Information Graphics
• Chapter 9 - Interactive Graphics and Visualizations
Part 4 - PROFILES
• John Grimwade (Condé Nast Traveler): The Infographics Gentleman (personal site)
• Juan Velasco and Fernando Baptista (National Geographic Magazine): Information Art
• Steve Duenes and Xaquín González (The New York Times): All the Graphics That Are Fit to Print
• Hannah Fairfield (The Washington Post): Capital Infographics
• Jan Schwochow (Golden Section Graphics): Germanic Precision
• Geoff McGhee (Stanford University , Journalism in the Age of Data): Visualization and Academia
• Hans Rosling (Gapminder): Quantitative Humanism
• Moritz Stefaner (Well-Formed Data): Truth and Beauty Operator
• Jan Willem Tulp (Tulp Interactive) and Gregor Aisch (Driven By Data): The Rising Stars
• Stefanie Posavec (It's Been Real): Visualizing Literature


